"waiting for trigger" showed on the HPLC autosampler?
What is the English injection bottle?
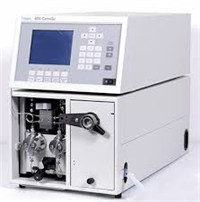
The usage, attention and application of the gas chromatograph?
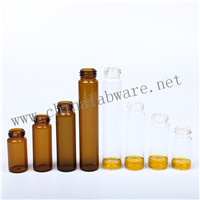
Where can I buy the sampling vials to store chemical reagents?
What is the mean of no vial deteoteo when have HPLC analysis?
How much liquid does autosampler vials hold?
What is the principle of gas chromatography?
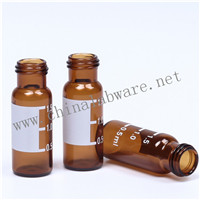
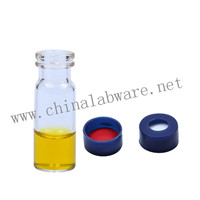
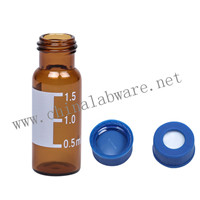
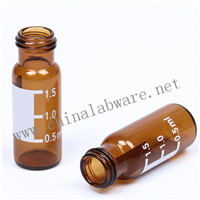
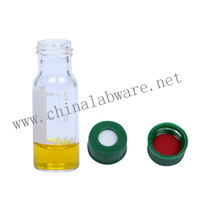
Introduction to 1.5ml/2ml chromatography vials / Autosampler vials / chromatography bottles
Old wide mouth glass vials can't be opened.
DO YOU HAVE A QUESTION REGARDING OUR PRODUCTS?
CONTACT USproduct list
CONTACT US
0086-15157000820
008615157009788
NO.160 Hangtou Street,Quzhou City,Zhejiang Province,China 324000

.jpg)


